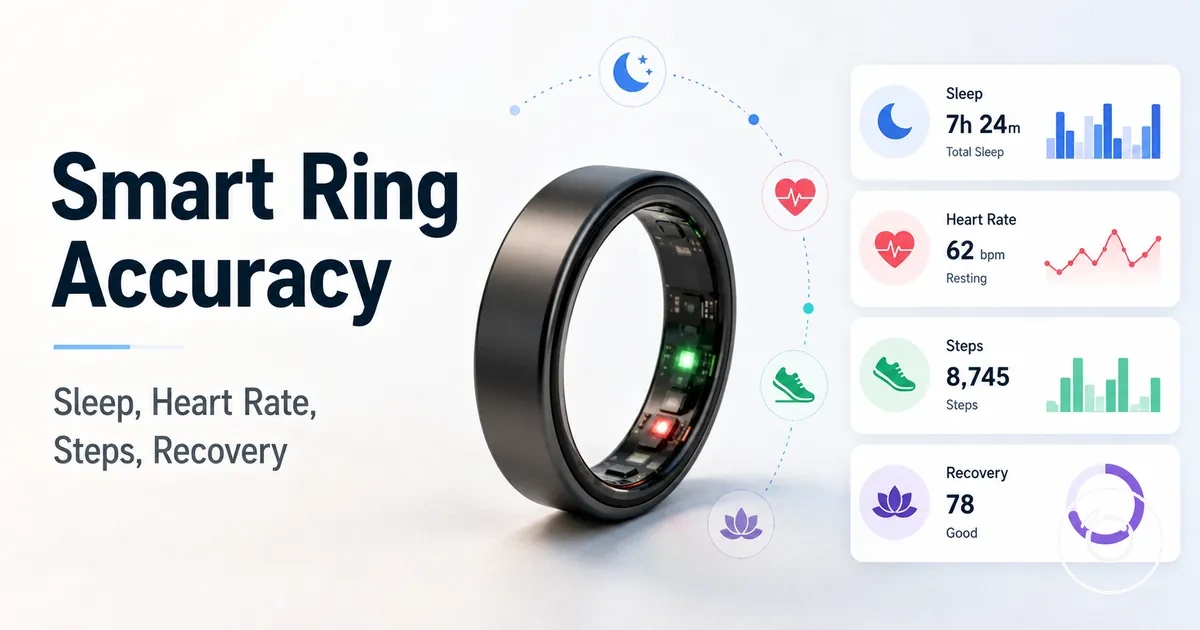
Fitness smart ring accuracy for health and activity tracking
A fitness smart ring provides estimated health tracking and activity tracking readings from sensor data collected at the finger. Its accuracy is most useful for observing patterns rather than confirming exact measurements, and the expected accuracy differs across sleep, heart rate, steps, and recovery.
Consistent wear can make trends easier to interpret by establishing a personal baseline and showing variation over time. This trend tracking can support everyday decisions, while individual readings remain limited by fit, skin contact, signal quality, sensor quality, user context, and the algorithm used to interpret the data.
This page evaluates how a smart ring estimates sleep, heart rate, steps, and recovery, and explains the limits that apply to each metric. For broader context on features, sensors, and use cases, see the fitness smart ring guide.
A wearable ring is a wellness tracking tool rather than a source of exact or diagnostic measurement. Each metric needs separate evaluation because it relies on different signals and interpretation layers.
What accuracy means for a fitness smart ring
Fitness smart ring accuracy is the closeness and consistency of a ring-generated estimate compared with the real physiological or activity signal for a tracked metric. Accuracy therefore has two practical values: how closely an individual reading reflects the underlying signal and how consistently the ring identifies a trend across repeated data points.
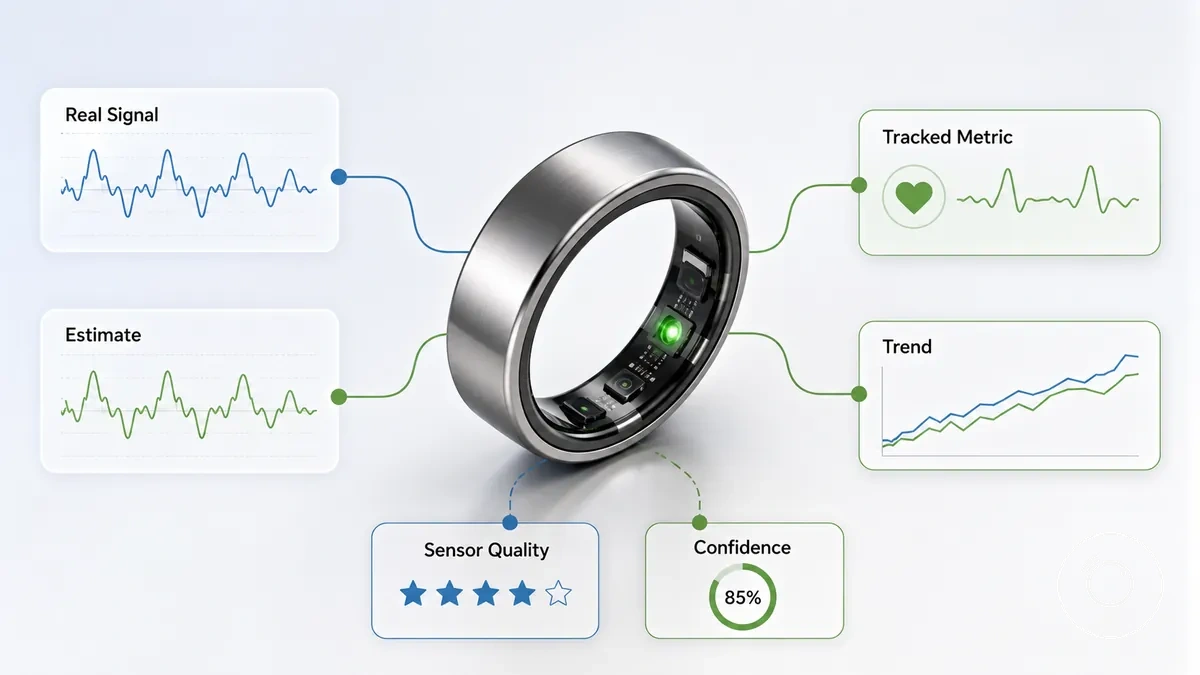
A fitness smart ring does not measure every tracked metric in the same way. Direct sensor data becomes a measurement or tracking estimate, with higher confidence when sensor quality and signal quality remain stable, while algorithmic estimation creates a practical limitation when the metric must be inferred rather than directly observed.
Useful trend consistency does not require each reading to be an exact measurement because a stable baseline can still show meaningful change over time. Consumer tracking is separate from medical-grade validation unless the specific device and feature are cleared for that purpose.
Accuracy limits for medical and diagnostic use
Fitness smart ring data should usually be treated as wellness tracking rather than medical use unless a specific device feature has an appropriate device claim or clearance. Heart rate, sleep data, oxygen-related signals, and a recovery score can support health awareness, but these outputs from a consumer tracker are not equivalent to clinical measurement.
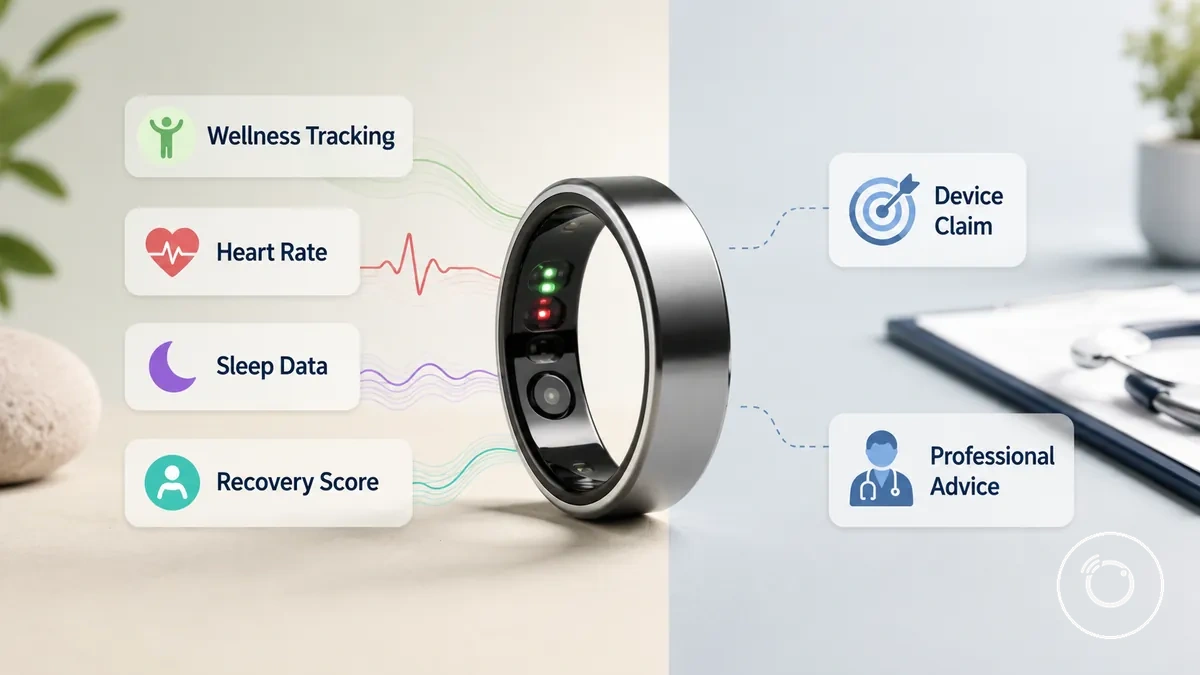
Caution: Consumer tracking is intended to support awareness, not diagnostic use. A feature should only be considered suitable for medical use when the specific device claim and any applicable clearance support that purpose; otherwise, the data should not replace medical advice.
If an irregular reading is isolated, compare it with later readings before drawing conclusions. If an irregular reading becomes a repeated pattern or is accompanied by concerning symptoms, seek professional advice instead of relying on the device to interpret the result.
Accuracy across core smart ring metrics
Fitness smart ring accuracy differs by metric because sleep accuracy, heart rate accuracy, step tracking, and a recovery score rely on different sensor input, measurement conditions, and algorithm output. Practical confidence is therefore usually stronger for identifying long-term trends than for interpreting a single reading.
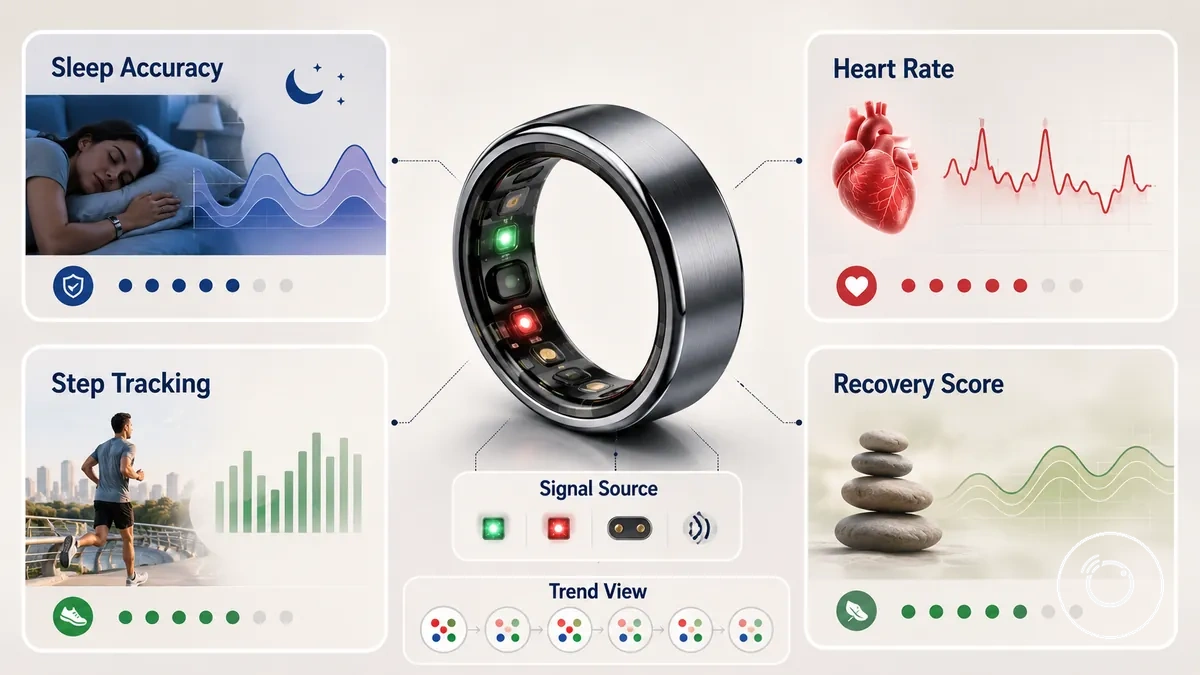
The table below compares each metric by its main signal source, common accuracy strength, common weakness, and best-use interpretation. For more context about sensors and health metrics, it helps to understand how different sensor inputs produce different tracking outputs and levels of practical confidence.
| Metric | Main signal source | Usually stronger for | Common weakness | Best-use interpretation |
|---|---|---|---|---|
| Sleep accuracy | Movement and heart rate patterns | Overall sleep duration and sleep trend | Sleep stage estimate | Assess long-term sleep patterns rather than one night's result |
| Heart rate accuracy | Optical sensor input | Resting and steady-state heart rate | Motion-related reading interference | Track changes over time instead of one isolated reading |
| Step tracking | Hand movement sensor input | General activity estimate | False positives from non-walking arm movement | Use as an overall activity trend |
| Recovery score | HRV baseline, heart rate, sleep data, and algorithm output | Readiness trend over multiple days | Sensitivity to changing baseline conditions | Compare with your personal trend rather than a single score |
Repeated measurements usually provide higher practical confidence than relying on one reading from any single metric.
Sleep timing and sleep stage estimates
Sleep timing is usually more confidence-friendly than a sleep stage estimate because rest detection and wake detection rely on more consistent movement and heart rate pattern signals than stage classification. A sleep stage estimate is an algorithm-based interpretation and should be viewed as an estimate rather than an exact classification.
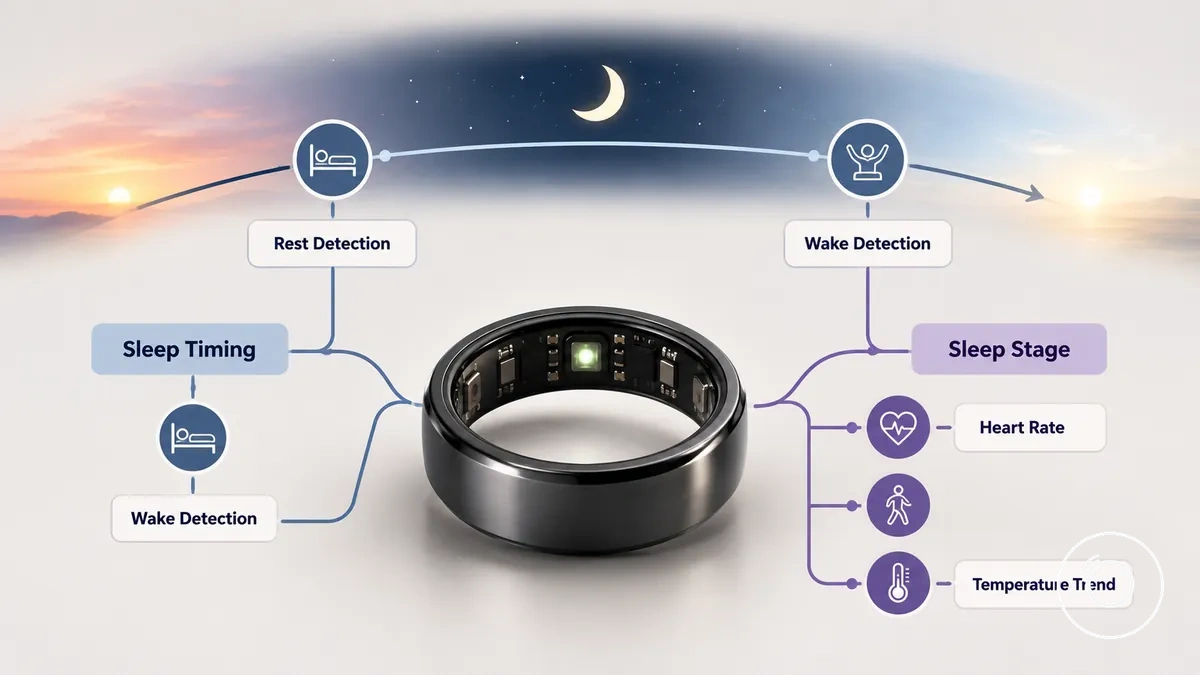
Sleep estimates combine movement, heart rate pattern, temperature trend, and algorithm processing to determine sleep timing and assign stage labels. These signal sources support sleep duration and overnight analysis, while stage confidence remains lower because the algorithm interprets multiple physiological patterns instead of directly measuring sleep stages.
| Sleep duration or timing | Sleep stage estimate |
|---|---|
| Usually provides higher confidence for rest detection, wake detection, sleep timing, and total sleep duration. | Uses movement, heart rate pattern, temperature trend, and algorithm interpretation to estimate stage labels with lower confidence than overall sleep timing. |
Overnight consistency is often more useful for recovery interpretation than focusing on one night's stage labels. For a broader explanation of sleep tracking accuracy, compare trends across multiple nights instead of relying on a single sleep estimate.
Resting heart rate and heart rate variability
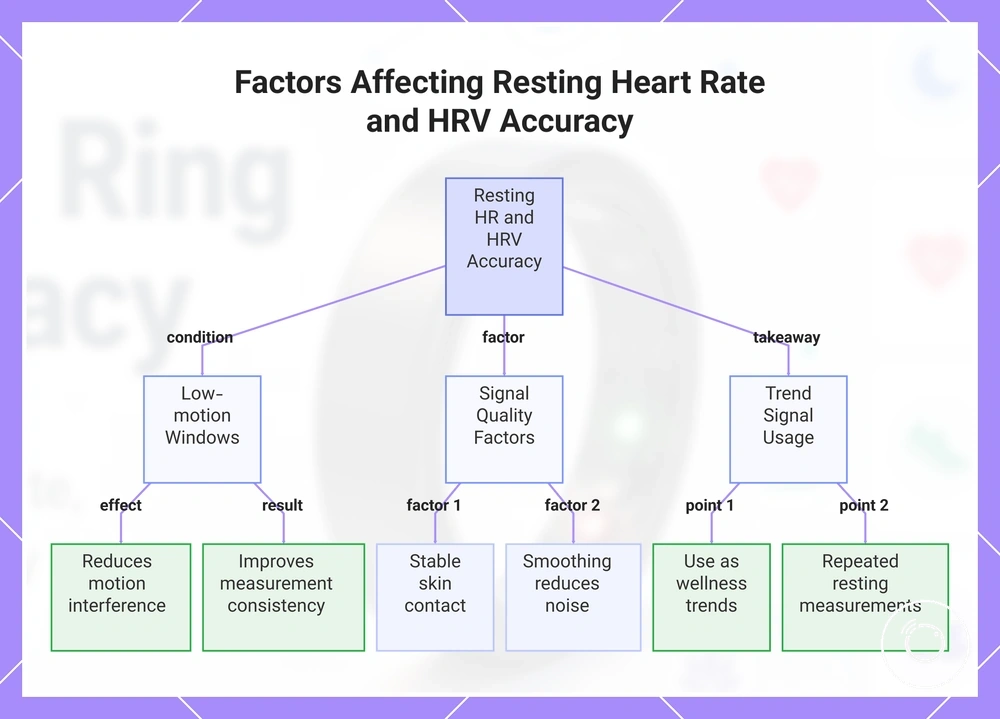
Resting heart rate and heart rate variability (HRV) generally produce cleaner readings during low-motion windows than during active movement because reduced motion interference supports a clearer optical signal. These heart metrics are most useful as wellness trend signals over time rather than as isolated measurements.
Resting heart rate and HRV accuracy improve when stable skin contact helps maintain optical signal quality and smoothing reduces short-term signal noise. Loose skin contact or frequent movement can create noisier readings, so resting periods usually provide a more consistent baseline for comparing heart rate and HRV trends than active periods.
- Stable skin contact strengthens optical signal quality and supports cleaner resting heart rate and HRV readings.
- Low-motion windows reduce motion interference and improve measurement consistency.
- Frequent movement or a loose fit can introduce noisier readings that require additional smoothing.
- Repeated resting measurements provide a more consistent baseline for interpreting long-term heart rate and HRV trends.
This chart shows the key conditions for accurate resting heart rate and HRV readings, signal quality factors, and how to use the measurements as trends.
Steps, hand movement, and activity estimates
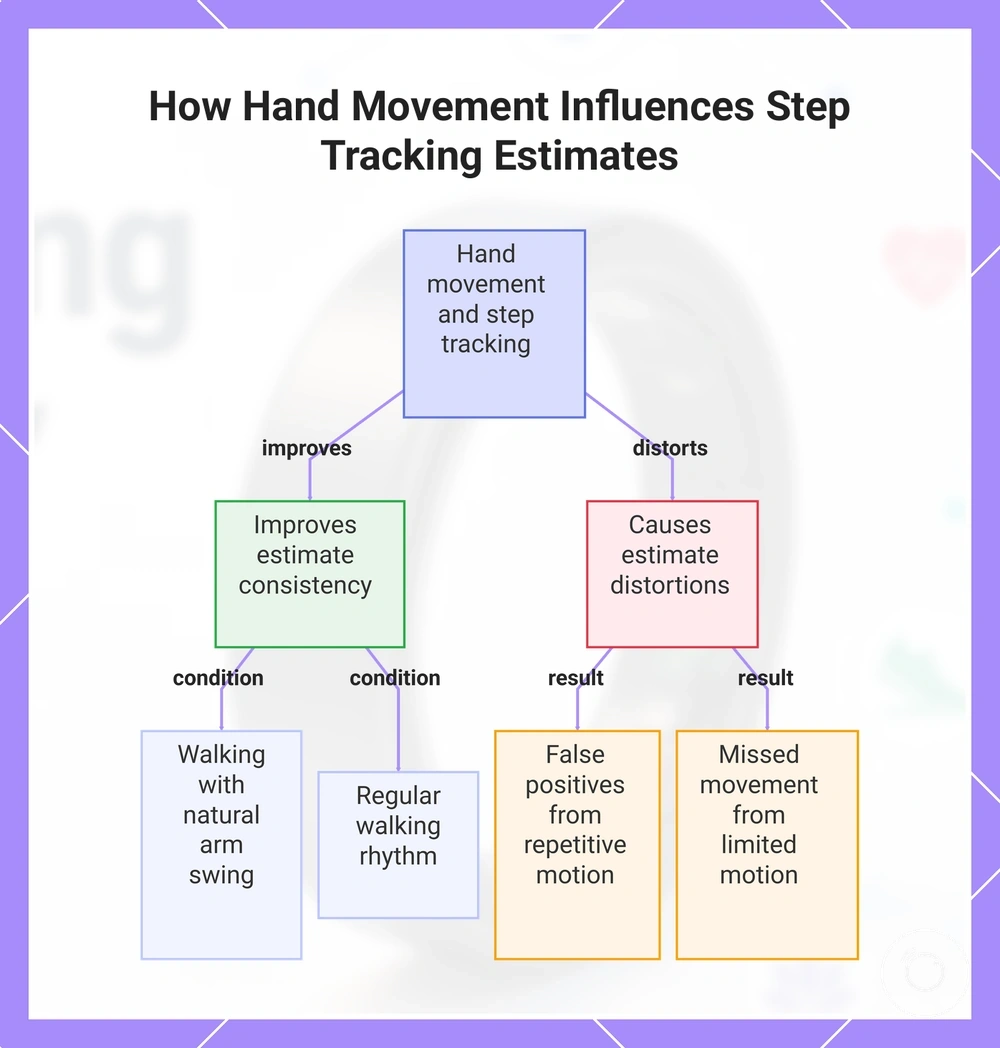
Step tracking estimates body movement by interpreting finger and hand movement, so hand movement can both improve and distort an activity estimate. Because a smart ring measures movement differently from a wrist device or a phone, step count results may differ for the same activity context.
Walking rhythm usually supports a more consistent activity estimate because hand movement follows a regular pattern. False positives can occur when repeated hand motion is interpreted as walking, while missed movement is more likely when hand movement is limited during carrying tasks, cycling, or certain workouts. For more detail about activity tracking factors, compare how different activity contexts influence movement estimates.
- Walking with a natural arm swing: usually supports more consistent step tracking.
- Carrying objects: reduced hand movement can increase missed movement.
- Cycling: limited walking rhythm may reduce detected step count.
- Desk work or a gesture-heavy routine: repeated hand motion can increase false positives.
- Workouts: activity estimates are usually more consistent when hand movement closely matches whole-body movement.
This chart shows how hand movement can both improve and distort step tracking estimates, with common activity contexts.
Recovery and readiness-style scores
A recovery score or readiness score is a composite score that interprets multiple input signals rather than directly measuring physical recovery. It is best understood as a recovery estimate and directional signal, not as exact readiness, medical advice, or a universal rule for performance.
Recovery score interpretation compares current inputs with baseline history rather than evaluating a single measurement in isolation. Sleep quality, resting heart rate, HRV, temperature trend, and activity load each contribute to the composite score, while score sensitivity reflects how current patterns compare with an individual's usual baseline.
A concise breakdown of common composite inputs includes:
- Sleep quality: provides recovery-related context within the composite score.
- Resting heart rate and HRV: contribute trend information relative to baseline history.
- Temperature trend: adds context when it differs from an individual's typical pattern.
- Activity load: reflects recent physical demand that can influence the recovery estimate.
- Baseline history: provides the reference used to interpret changes as a directional signal instead of a direct physical measurement.
Sensor and wear factors that affect accuracy
Wear conditions often explain changes in sensor accuracy more than the metric itself. Ring sensor readings are influenced by wear factors such as fit, placement, motion, temperature, signal continuity, and the algorithm baseline, so a reading issue may reflect the measurement context rather than a problem with the sensor.
Controllable factors include fit, placement, and motion during measurement, while temperature, signal continuity, and baseline development are influenced partly by the measurement context and the device's interpretation. Distinguishing these criteria helps separate user-adjustable factors from algorithm limitations and reduces interpretation risk.
| Factor | Attribute affected | Condition to check | Likely effect on readings |
|---|---|---|---|
| Fit | Skin contact | Ring maintains secure and consistent contact with the finger | Inconsistent contact can reduce signal quality and increase interpretation risk. |
| Placement | Sensor position | Sensor remains correctly aligned on the intended finger | Changing placement can reduce measurement consistency. |
| Motion | Signal quality | Excessive finger or hand movement during measurement | Motion can introduce signal noise and affect reading consistency. |
| Temperature | Signal factor | Noticeable changes in skin or environmental temperature | Temperature changes can influence sensor signals and reading interpretation. |
| Signal continuity | Data continuity | Continuous wear with minimal signal gaps | Signal gaps can reduce the reliability of trend interpretation. |
| Baseline | Algorithm interpretation | Sufficient personal history to establish a baseline | A limited baseline increases interpretation risk because fewer historical comparisons are available. |
Use these criteria to judge whether a reading issue is caused by measurement conditions before assuming a device limitation, and review sizing and finger placement when a controllable wear factor is likely to affect accuracy.
Ring fit, finger placement, and skin contact
Ring fit affects sensor contact, which influences the consistency of heart rate, sleep, and activity signals. A fit that maintains steady skin contact without excessive snugness or looseness is more likely to support consistent readings, while a contact gap can weaken signal consistency.
Finger placement and sensor alignment also affect measurement quality. Frequent rotation, movement away from the intended sensor position, or swelling that changes contact during wear can reduce signal reliability because skin contact becomes less consistent.
Check these local fit criteria before treating weak readings as a sensor problem:
- Snugness: the ring should maintain consistent skin contact without excessive pressure or discomfort.
- Rotation: frequent rotation can move the sensor away from its intended position and reduce signal consistency.
- Sensor alignment: the sensor should remain aligned against the skin to support stable measurements.
- Finger choice: use a finger position that maintains consistent sensor contact during normal wear.
- Swelling and looseness: changes in finger size can create excessive pressure or a contact gap that weakens readings.
- Contact gap: repeated gaps between the sensor and skin can reduce the reliability of heart rate, sleep, and activity signals.
Motion, temperature, and signal gaps
Noisy data or missing data can result from temporary measurement conditions rather than a lasting accuracy problem. Motion during exercise, temperature-related changes in skin contact, and a signal gap caused by interrupted wear can reduce signal continuity, so unstable readings should be interpreted against the wearing condition.
Motion can introduce noisy data, while cold hands, sweat, or poor circulation can weaken sensor contact and signal quality. A charging gap, removal period, or interrupted overnight wear can create missing data because tracking is paused, but these conditions do not by themselves indicate a faulty device.
- Exercise motion: rapid hand movement can create noisy data and greater reading variation.
- Cold hands or poor circulation: reduced skin contact can weaken signal quality and produce an unstable reading.
- Sweat: moisture can disrupt sensor contact and contribute to noisy data during activity.
- Charging gap or removal period: tracking pauses during these periods, creating missing data instead of continuous measurements.
- Interrupted overnight wear: breaks in wear can create a signal gap and reduce sleep-tracking continuity.
Algorithms, baselines, and data smoothing
An algorithm interprets sensor signals to produce a displayed metric, so accuracy differences can arise from software interpretation as well as raw sensor capture. A personal baseline, metric definition, and data smoothing method can influence the estimate without implying that every brand uses the same calculation logic.
The path from sensor signal to displayed metric follows a conceptual three-step flow:
- Signal capture: the ring records raw physiological signals during wear.
- Algorithm interpretation: the software model applies data smoothing, outlier handling, and the relevant metric definition to convert the signal into an estimate.
- Displayed metric: the processed estimate appears in the app or device instead of the unprocessed sensor signal.
A baseline can become more representative after a calibration period because the algorithm has more personal history for comparison. A firmware update can also change smoothing, outlier handling, or recalculation rules, which can alter a displayed metric even when the sensor hardware is unchanged.
Why smart ring data can look inaccurate
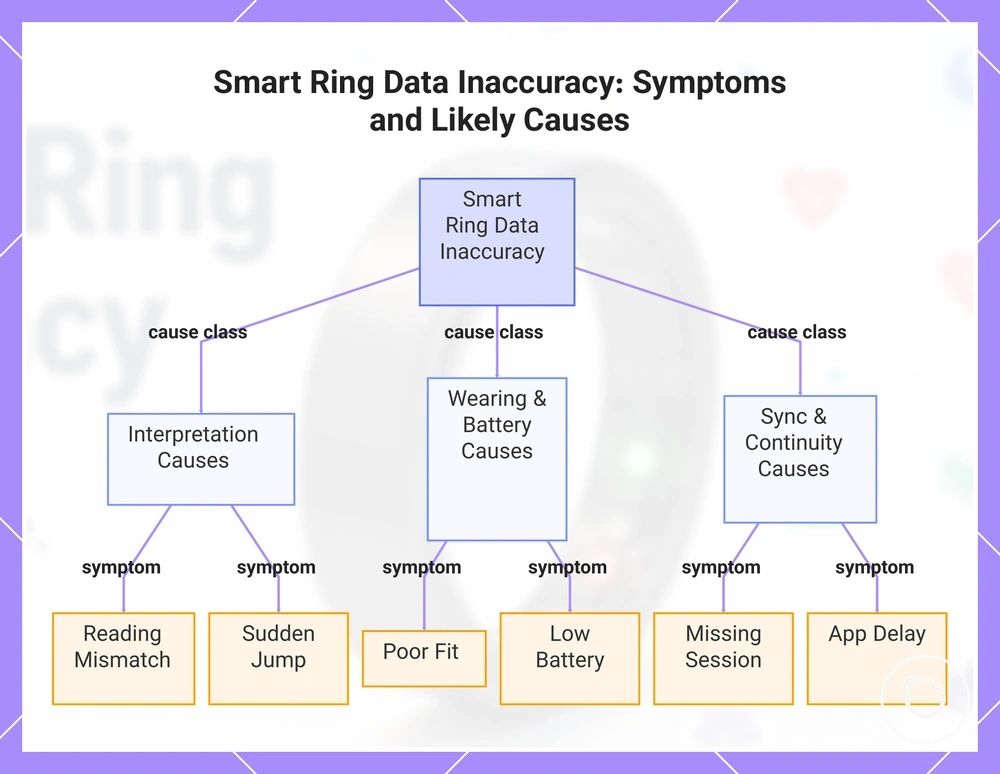
Apparent inaccurate data does not always indicate a tracking failure. A reading mismatch can come from software interpretation, wearing conditions, syncing behaviour, or a persistent tracking problem, so the symptom should be matched to the most likely cause class.
Differences between a smart ring and a reference device, a sudden jump in a metric, or inconsistent data after synchronisation can reflect metric definitions, a baseline change, or recalculation rather than identical measurements being processed in the same way. A missing session, app delay, sync lag, poor fit, or low battery can instead interrupt, delay, or weaken tracking continuity.
Use the checklist below to distinguish interpretation, wearing conditions, syncing, and persistent tracking failure. An isolated data gap usually calls for a condition check, while repeated problems after the relevant condition is corrected justify further investigation.
- Reading mismatch: When values differ from a reference device, the likely cause class is interpretation or metric definition, meaning the devices may calculate or display different estimates.
- Sudden jump: When a metric changes unexpectedly, the likely cause class is a baseline change or recalculation, meaning the displayed trend may have been reinterpreted.
- Missing session: When an activity or sleep record is absent, the likely cause class is interrupted wear or recording continuity, meaning part of the session was not captured.
- App delay: When recent data has not appeared, the likely cause class is sync lag, meaning recorded information has not yet been transferred or displayed.
- Poor fit: When contact is unstable, the likely cause class is wearing condition, meaning signal capture can become inconsistent.
- Low battery: When power is insufficient for continued tracking or syncing, the likely cause class is interrupted operation, meaning data collection or transfer can stop.
If repeated missing sessions, app delays, or wrong readings continue after these conditions are checked, use the dedicated guide to tracking and syncing problems.
This chart categorizes six common symptoms of apparent data inaccuracy by their most likely cause class—interpretation, wearing/battery, or sync/continuity—to help users quickly identify the source of a reading issue. If symptoms persist after addressing the likely cause, refer to the dedicated guide for tracking and syncing problems.
Normal trend variation versus unreliable tracking
One abnormal reading is different from repeated unreliable tracking. Trend variation often reflects an isolated event, context-specific variance, or gradual baseline movement, while repeated gaps, an impossible value, or an inconsistent trend across multiple observations are stronger indicators of unreliable tracking.
Compare patterns over an appropriate time window instead of judging reliability from one odd reading. The comparison below separates isolated variation from recurring patterns so that a single anomaly is not mistaken for device failure or a health diagnosis.
| Normal variation | Possible unreliable tracking |
|---|---|
| A single abnormal reading or one-night anomaly is followed by a return to the usual trend. | The same abnormal reading appears repeatedly or remains inconsistent across multiple sessions. |
| No repeated gap is present, and most sessions remain complete. | A repeated gap occurs across similar sessions, suggesting recurring tracking inconsistency. |
| An unusual value remains plausible within the surrounding context. | An impossible value appears or recurs without fitting the surrounding pattern. |
| Context-specific variance aligns with a clear change in routine, activity, sleep, or wearing conditions. | An inconsistent trend continues across different contexts without a clear contextual explanation. |
| Baseline movement develops gradually and forms a consistent trend over time. | Baseline movement changes abruptly and repeatedly without establishing a stable pattern during the observed time window. |
When calibration or syncing can change readings
App-visible readings can change after a calibration period or syncing without indicating that the original measurement was incorrect. During an initial wear period, a baseline update can refine personal reference values, so displayed readings may change as additional data is incorporated.
Delayed processing can also change what appears in the app after new information is analysed. A baseline update, firmware change, app refresh, cloud processing, or recovery recalculation can affect displayed readings under the relevant conditions, but these processes do not guarantee that every metric will change after each sync.
- Initial wear period: The calibration period can refine baseline values, so early displayed readings may be updated as more personal data is collected.
- App refresh: Syncing and an app refresh can display data that was already recorded but had not yet appeared in the app.
- Delayed processing: Cloud processing can update displayed readings after background analysis is completed.
- Firmware change: A firmware change can alter how supported metrics are processed or presented, which can result in a recalculated score.
- Manual edit: A manual edit to an activity or recorded session can update related displayed metrics.
- Recovery recalculation: Recovery recalculation can change a displayed recovery value when newly processed data is incorporated into the calculation.
How to compare smart ring accuracy fairly
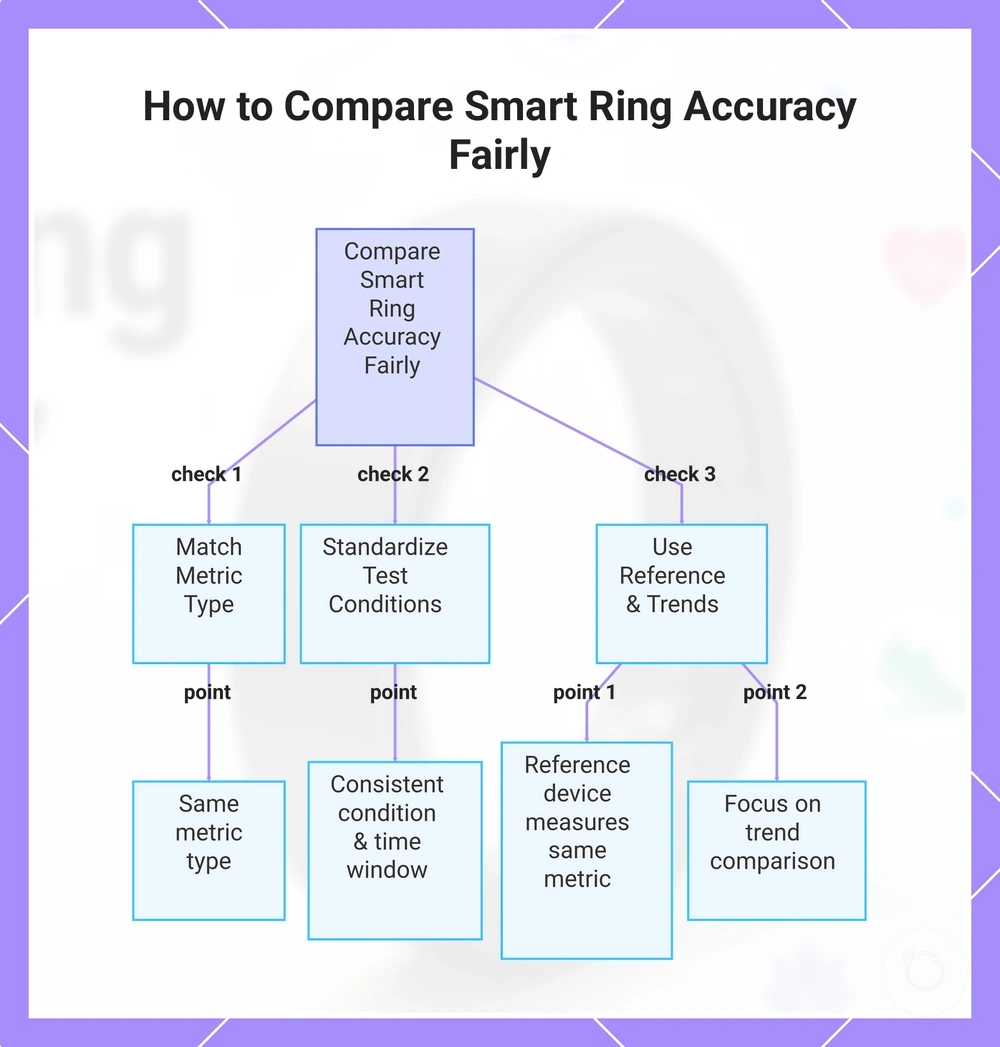
To compare accuracy fairly, use the same metric type, test condition, and time window instead of relying on one isolated reading. A fair comparison is based on repeated readings collected under comparable conditions rather than expecting exact parity between different devices.
A reference device is most useful when it measures the same metric under the same comparison condition. Differences in sensors, processing methods, or reporting can create expected variance, so a benchmark reading should support interpretation instead of serving as proof that one device is more accurate.
Use the checklist below before judging an accuracy comparison. Focusing on trend comparison across repeated readings leads to a more practical judgment than comparing single measurements in isolation.
- Metric type: Compare the same metric, such as heart rate with heart rate or sleep duration with sleep duration.
- Measurement condition: Keep the test condition consistent by matching activity, environment, wearing position, and timing.
- Time window: Evaluate repeated readings collected over the same time window instead of using a single result.
- Reference source: Choose a reference device that measures the same metric under a comparable condition, while allowing for expected variance between devices.
- Interpretation goal: Judge overall trends and metric-specific strengths rather than chasing exact parity from every individual reading.
This chart shows the three main checklist categories for fairly comparing smart ring accuracy: matching metric type, standardizing test conditions, and using a reference device with trend interpretation.
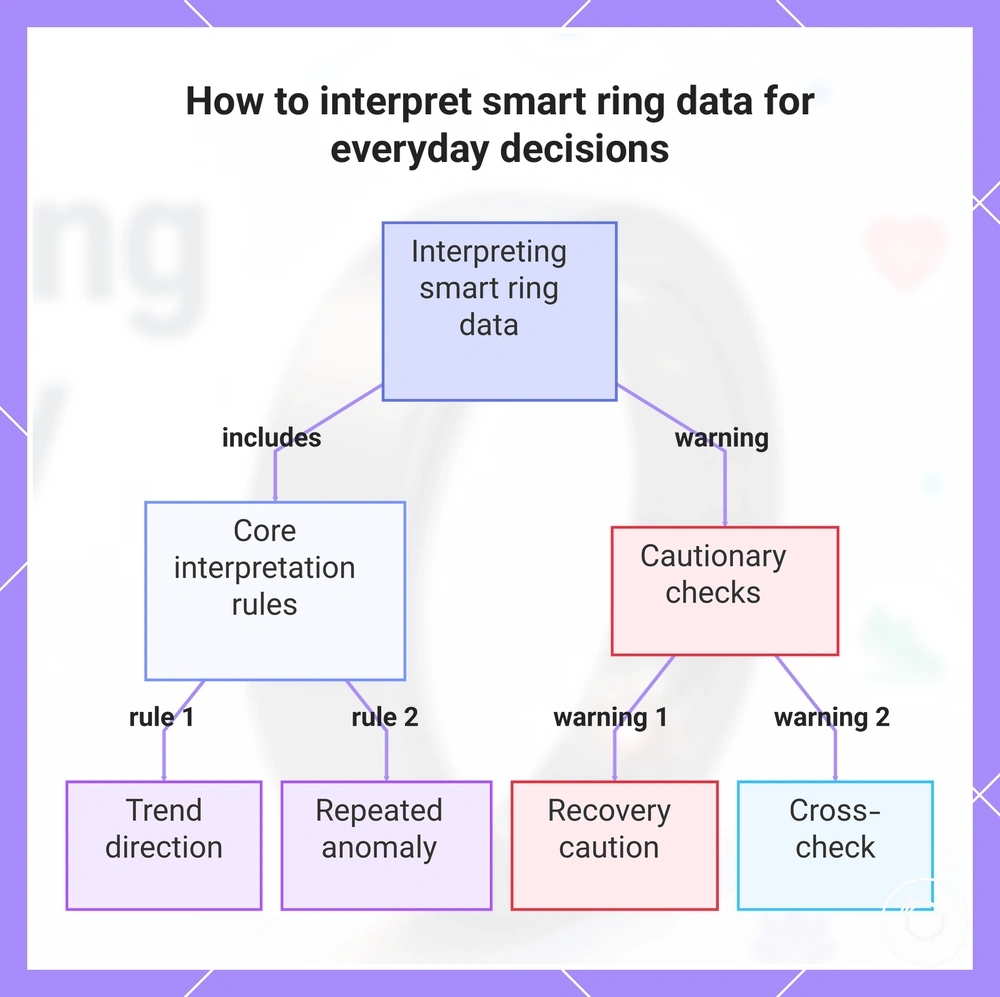
How to interpret smart ring data for everyday decisions
Use smart ring data to guide everyday decisions by following trend direction instead of relying on single-moment certainty. Daily interpretation is most useful when readings are viewed as a pattern over time rather than as exact outcomes from one measurement.
Metric confidence is stronger when similar readings remain consistent against your own baseline change over repeated measurements. A repeated anomaly deserves closer attention than an isolated result, while recovery caution means recovery metrics should be interpreted as practical trend signals rather than guarantees of readiness.
Use the checklist below to interpret smart ring data consistently. When unusual readings are repeated or a decision is important, cross-check with another reliable source and rely on patterns over time instead of any single reading.
- Trend direction: Base everyday decisions on whether the overall trend is improving, stable, or declining across repeated readings.
- Repeated anomaly: Treat a repeated anomaly as more meaningful than a one-time result and monitor whether the same pattern continues.
- Metric confidence: Give greater confidence to metrics that remain consistent under similar measurement conditions over time.
- Baseline change: Compare new readings with your own established baseline instead of another person's results.
- Recovery caution: Use recovery information as a practical guide rather than as a guarantee of performance or readiness.
- Cross-check: Cross-check unusual, repeated, or high-stakes results with another trusted source before acting on them.
This chart shows the key guidelines for interpreting smart ring data, focusing on pattern-based rules and cautionary checks.