
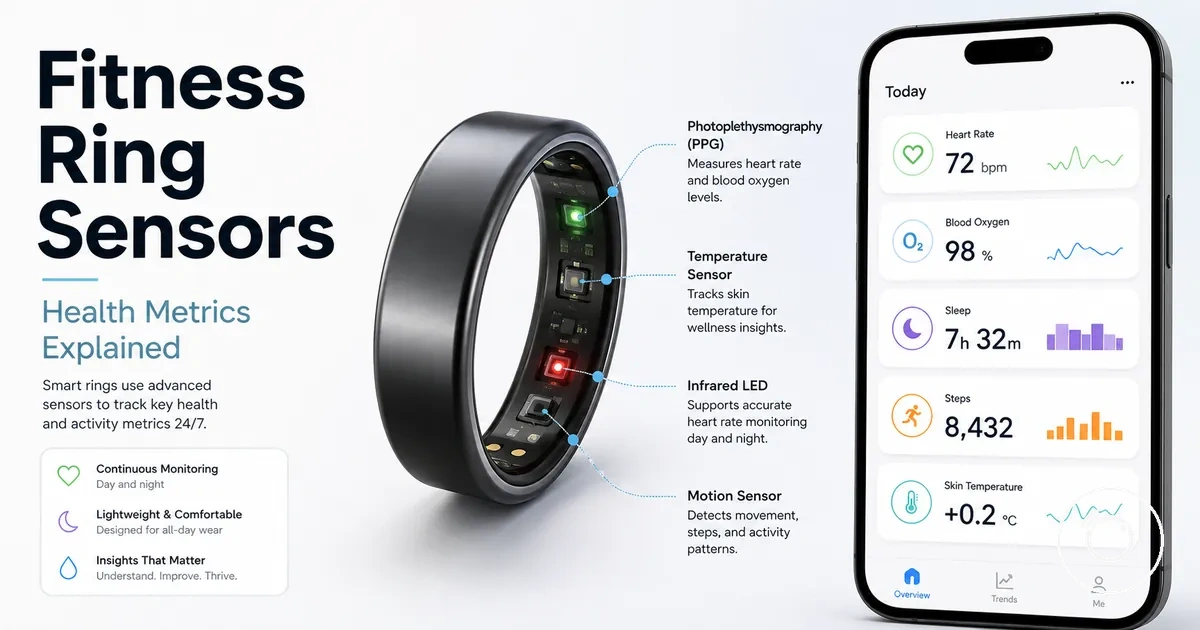
Fitness smart ring sensors and health metrics
A fitness smart ring is a finger-worn wearable that uses sensors to collect physiological and movement signals. Those sensor inputs are processed through app interpretation to produce health metrics that represent wellness trends rather than direct medical conclusions. The measurements shown by a fitness smart ring reflect sensor data, software processing, and interpretation together.
People often look for clear explanations because a sensor reading and a displayed health metric are not the same thing. The fitness smart ring hub provides broader context for understanding how these wearables fit into everyday health tracking. Readings can differ because model variation affects the available sensors and firmware features, while fit and wearing conditions influence how consistently the sensors contact the finger.
This page explains what a fitness smart ring can measure, how sensors become health metrics through app interpretation, and where practical limitations apply. It focuses on how signals are transformed into meaningful wellness trends while keeping clear boundaries between wellness monitoring and medical certainty.
How fitness smart rings convert body signals into health metrics
Fitness smart rings convert body signals into health metrics by capturing sensor data and processing it through app interpretation. Sensors detect physical signals at the skin, software algorithms organise those signals into meaningful measurements, and the app displays results as wellness trends rather than raw sensor output. This section explains the conversion chain without extending into product comparison or medical conclusions.
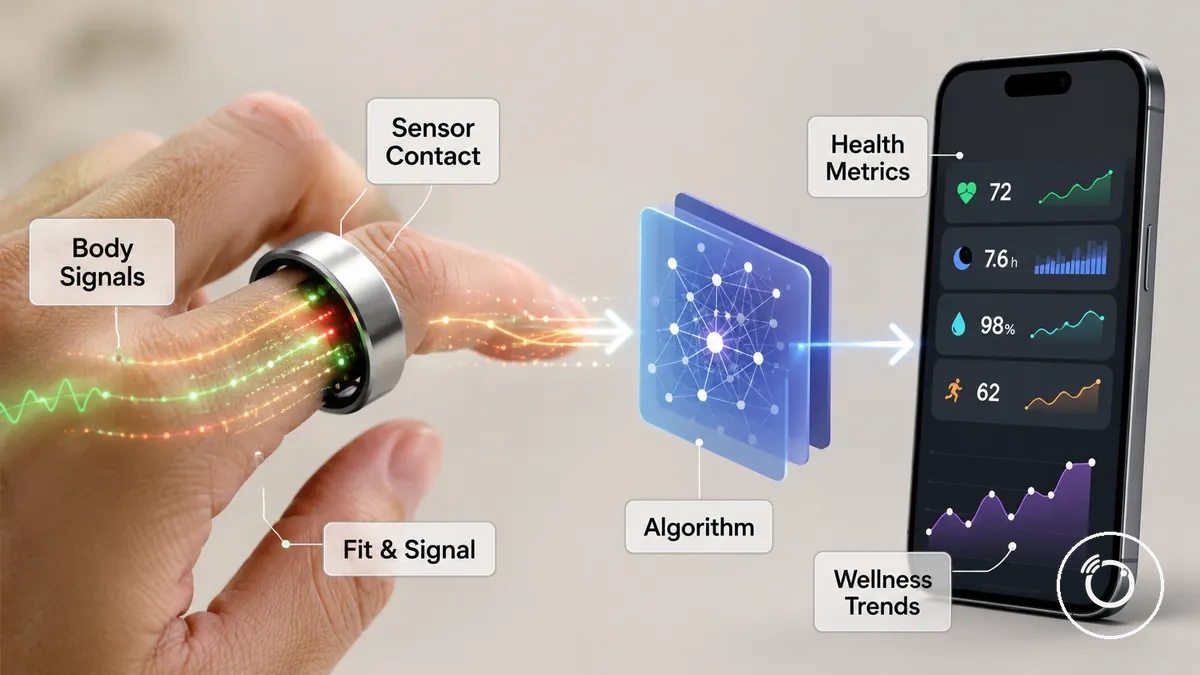
Sensor contact is the starting point because consistent contact between the ring and the finger allows sensors to collect usable signals. The algorithm then interprets those signals into health metrics that the app presents as trends or summaries instead of direct sensor readings. The amount of detail available is influenced by model variation, fit, wearing condition, firmware, and signal quality, so the displayed interpretation reflects those conditions.
For example, a fitness smart ring may convert pulse-related signals into an estimated heart rate or combine movement patterns with timing information to estimate sleep timing. For a broader explanation of the underlying wearable concept, see how fitness smart rings work. These outputs are intended for tracking wellness trends over time, and their interpretation should not be treated as a medical diagnosis.
How fitness smart rings convert body signals into health metrics can be summarised by the relationship between captured signals, software interpretation, and displayed results. The table below organises each stage of that process and its practical limitation.
| Entity/part | Attribute/criterion | Value/condition | Effect or limitation |
|---|---|---|---|
| Sensors | Input | Skin-level and movement signals | Provide raw data for algorithmic processing |
| Algorithm | Interpretation | Processes captured signals into health metrics | Results reflect signal quality and processing methods |
| App | Display | Health metrics and wellness trends | Displayed values are influenced by model variation, fit, firmware, and wearing condition |
Core sensors inside a fitness smart ring
Core sensors inside a fitness smart ring are the main sensor groups that collect body signals for app interpretation into health metrics. Reading the sensor type, measured signal, and supported metric together provides a clearer understanding of what each component contributes. This section maps the primary sensor groups before later sections explain their individual functions in greater detail.
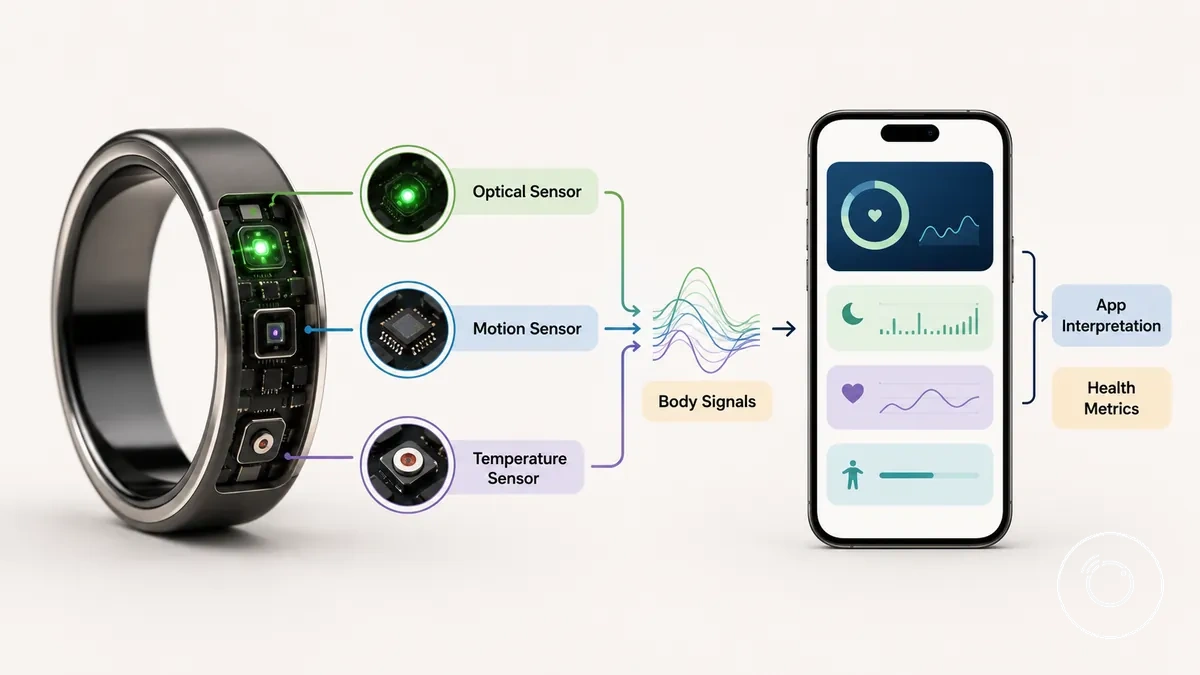
Optical sensors identify light-based pulse signals that support metrics such as heart rate or heart rate variability when fit, skin contact, and signal quality are sufficient. Motion sensors measure movement and orientation to support activity tracking and sleep-related metrics through app interpretation. Temperature sensors detect changes in skin temperature that can contribute to wellness trends when the device model and app include that capability, so available metrics differ between supported implementations.
Core sensors inside a fitness smart ring are easier to understand when each sensor group is viewed alongside its measured signal, supported metric, and practical limitation. The table below summarises those relationships without implying that every fitness smart ring includes every sensor type or produces the same health metrics.
| Sensor group | Measured signal | Metrics supported | Main limitation |
|---|---|---|---|
| Optical sensor | Light-based pulse signal | Heart rate, heart rate variability, and related wellness trends when signal quality is sufficient | Performance is influenced by fit, skin contact, and motion |
| Motion sensor | Movement and orientation | Activity tracking and sleep-related metrics through app interpretation | Results reflect movement patterns and model-specific processing |
| Temperature sensor | Skin temperature changes | Temperature trends and recovery-related insights when supported by the device and app | Available metrics differ by model features and interpretation methods |
Optical sensors for heart rate and blood oxygen signals
Optical sensors for heart rate and blood oxygen signals use PPG (photoplethysmography) to measure changes in reflected light from the skin and convert those light signals into wellness-related measurements. With consistent skin contact and sufficient signal quality, an optical sensor can estimate heart rate, provide input for HRV trends, and, on supported models, collect blood oxygen–related readings. Loose fit, frequent movement, or weak signal quality can reduce the reliability of the interpreted results.
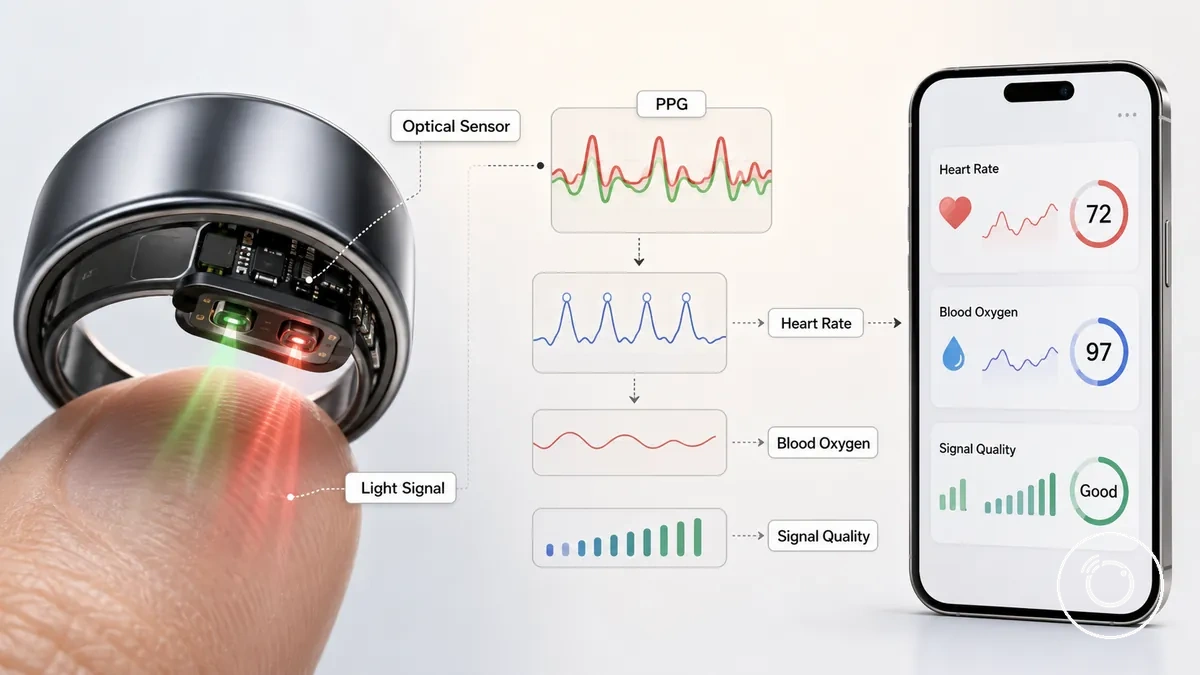
Optical sensors interpret different PPG light signals for different wellness purposes:
- PPG light signals detect pulse waveform changes to estimate heart rate.
- Pulse waveform quality provides input for HRV trend analysis when signal quality remains sufficient.
- Blood oxygen readings are derived from SpO2-style optical signals on supported devices, commonly during overnight or other suitable measurement periods.
- Stable skin contact improves signal quality, while poor fit and excessive movement can reduce the quality of app interpretation.
Optical signals support wellness tracking rather than medical diagnosis. Heart rate, HRV, and blood oxygen results should therefore be interpreted as wearable wellness information instead of automatic evidence of a health condition.
Motion sensors for steps, activity, and sleep movement
Motion sensors for steps, activity, and sleep movement use an accelerometer to detect changes in hand movement and identify movement patterns throughout the day and night. These signals help a fitness smart ring estimate steps, activity estimates, and sleep movement rather than directly measuring exercise performance. Loose fit, repetitive hand movement, or limited arm motion can reduce signal quality and increase false positive step estimates.
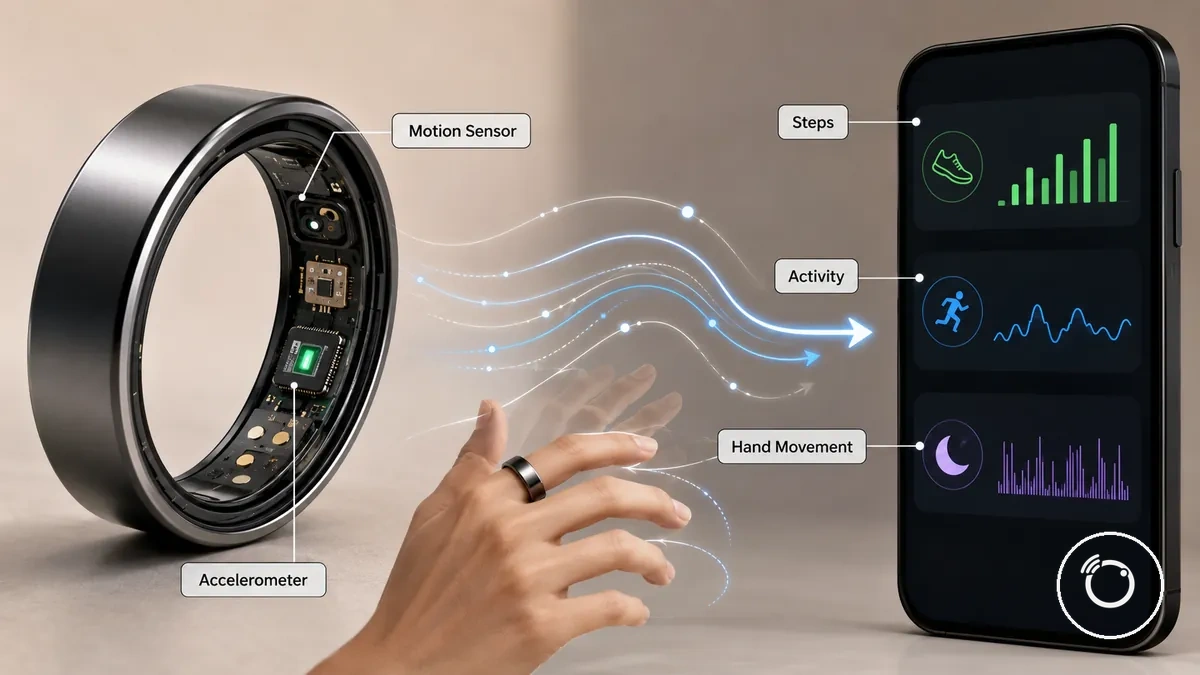
Motion sensors interpret accelerometer signals for different movement contexts:
- Step estimates are derived from repeated walking-related movement patterns instead of counting every hand movement.
- Movement intensity contributes to an activity estimate by grouping motion into broader activity patterns.
- Periods of inactivity and overnight sleep movement help interpret rest and sleep movement trends.
- Frequent hand movement without corresponding body movement can create false positive signals, so movement patterns are interpreted before assigning activity labels.
Motion sensors are more effective at detecting movement patterns than classifying specific exercises. Detailed exercise recognition, when available, relies on additional sensor context and supported activity interpretation rather than accelerometer signals alone.
Temperature sensors for body trend detection
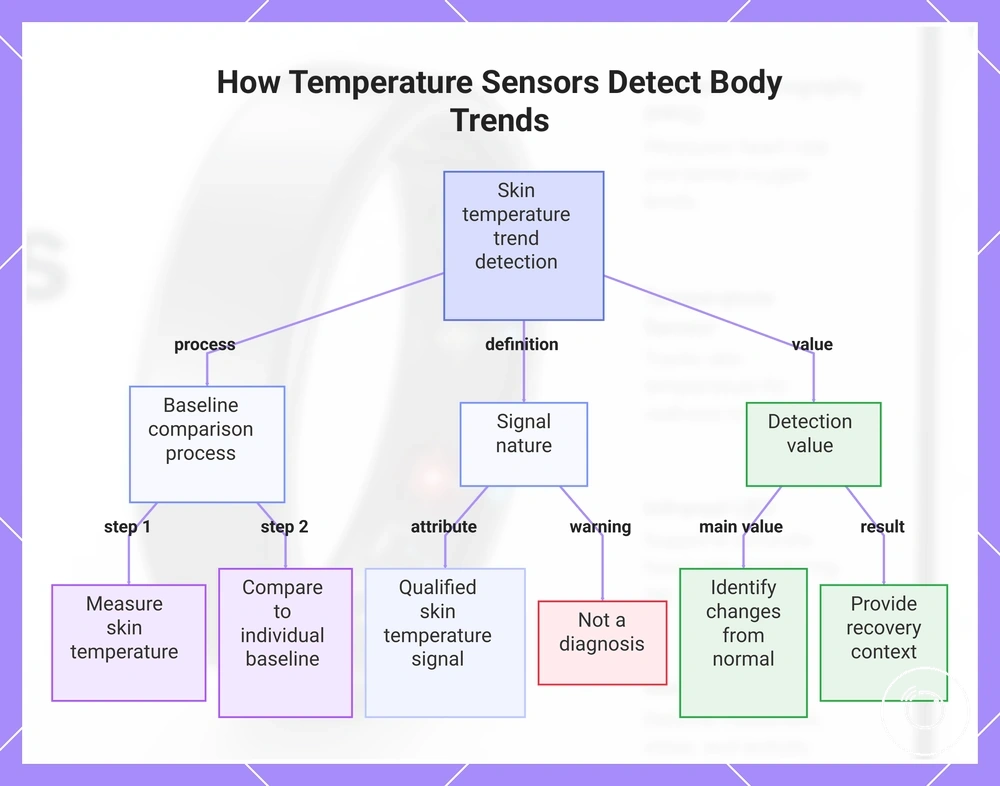
Temperature sensors for body trend detection measure skin temperature and compare it with an individual baseline instead of presenting a single universal body temperature value. A temperature sensor detects changes relative to that baseline, allowing a smart ring to identify overnight trends and deviations that support trend-based metric interpretation. Because the measurement reflects skin temperature, it is a qualified signal rather than a direct measure of core body temperature.
Temperature sensors compare each overnight trend with the established baseline instead of relying on a single reading. A sustained deviation may contribute to recovery context, while an illness-like change remains a qualified signal that requires cautious interpretation alongside other health metrics rather than serving as a diagnosis. The main value of the sensor is identifying meaningful changes from a person's normal pattern.
For example, when overnight skin temperature stays above an individual's baseline across repeated nightly measurements, the wearable ring may flag a deviation that adds recovery context without identifying the underlying cause.
This chart shows how skin temperature sensors in smart rings measure and compare to an individual baseline to detect overnight trends, and explains the qualified signal nature and value for recovery context.
Heart and breathing metrics measured by smart rings
Heart and breathing metrics measured by smart rings are wellness indicators derived from sensor data rather than substitutes for medical assessment. A smart ring may estimate heart rate, resting heart rate, HRV, blood oxygen, respiration, and breathing variation by combining optical or timing signals with device-specific interpretation logic. These metrics are most useful for observing personal trends, not for diagnosis or emergency screening.
Each metric depends on both signal quality and interpretation logic. Stable sensor contact and consistent wear support clearer trend data, while movement, poor fit, or interrupted readings can reduce confidence in the result. Recovery, stress, or breathing context should therefore be inferred only when the relevant metric changes relative to a personal baseline or repeated overnight pattern.
Heart and breathing metrics measured by smart rings are organised below by input signal, practical meaning, and limitation. The table shows how each metric can support wellness interpretation without assuming identical capability across all models.
| Metric | Input signal | Practical meaning | Limitation |
|---|---|---|---|
| Heart rate | PPG signal | Indicates pulse trends during supported rest or activity conditions. | Movement and weak signal quality can reduce reading reliability. |
| Resting heart rate | PPG signal collected during rest | Supports comparison of resting trends over time. | Meaningful comparison requires similar resting conditions and repeated readings. |
| HRV | Beat-to-beat timing derived from the PPG signal | May support recovery or stress interpretation when compared with a personal baseline. | An isolated value provides less context than a repeated trend. |
| Blood oxygen | Optical blood oxygen signal | May add overnight wellness context when the model supports this metric. | Availability and interpretation are model-specific and should not be treated as diagnostic. |
| Respiration | Breathing-related patterns derived from supported sensor signals | Estimates breathing rate during supported periods, commonly overnight. | Fit, movement, and device logic can affect the estimate. |
| Breathing variation | Repeated respiration patterns | Highlights changes in breathing regularity across comparable periods. | Variation indicates a trend, not the cause of the change. |
For example, a wearable ring may combine changes in HRV, resting heart rate, and respiration to add recovery context when those signals shift together relative to their usual baseline. This combined interpretation remains a wellness indicator and does not identify a specific health condition.
Heart rate and heart rate variability
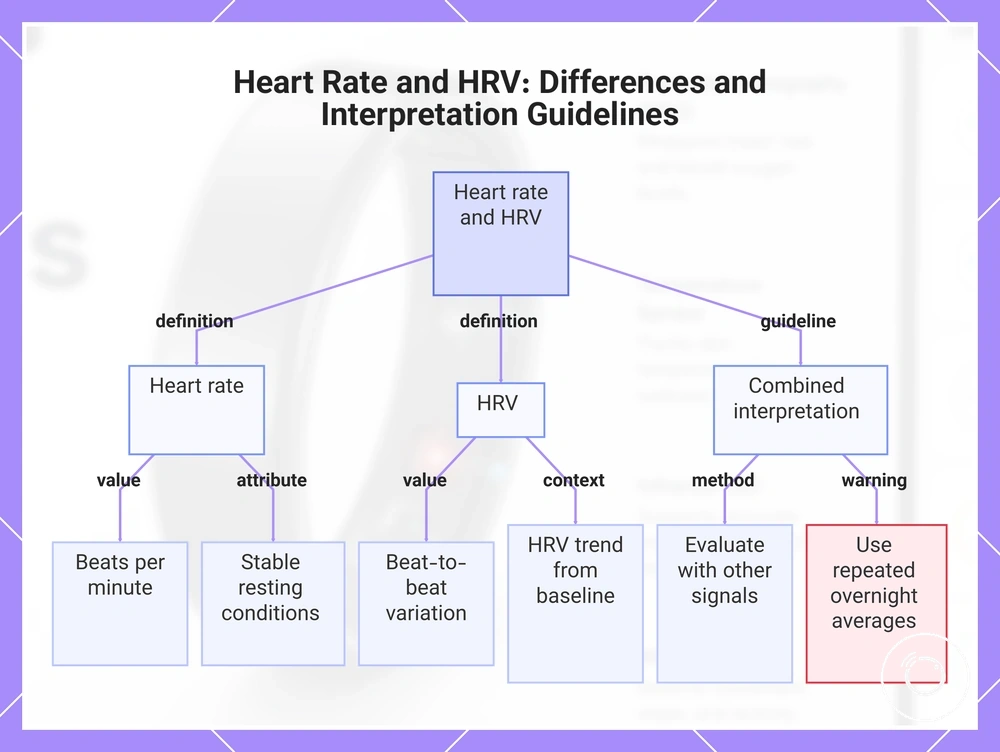
Heart rate and heart rate variability are related but different wellness signals derived from the same PPG signal. Heart rate measures the current number of beats per minute, while HRV measures the variation in time between consecutive heartbeats. A smart ring may also compare resting heart rate and overnight averages over time, but these trends depend on signal quality and should be interpreted relative to repeated measurements rather than in isolation.
Resting heart rate reflects heart rate during stable resting conditions, whereas HRV trend direction provides context about changes from a personal baseline. When interpreted alongside respiration, breathing variation, and, where supported, blood oxygen, HRV trends may contribute to recovery context or stress interpretation because multiple signals are evaluated together instead of relying on a single metric. The key distinction is that heart rate describes beats per minute, while HRV describes beat-to-beat variation within that rhythm.
For example, one lower HRV reading does not by itself indicate reduced recovery, increased stress, or illness. If HRV remains below its usual baseline across repeated overnight averages while resting heart rate changes in the same period, the combined trend may provide more meaningful wellness context than any isolated reading.
This chart explains the two related wellness signals, their definitions, and how to interpret trends using repeated measurements and multiple signals.
Blood oxygen, respiration, and overnight breathing variation
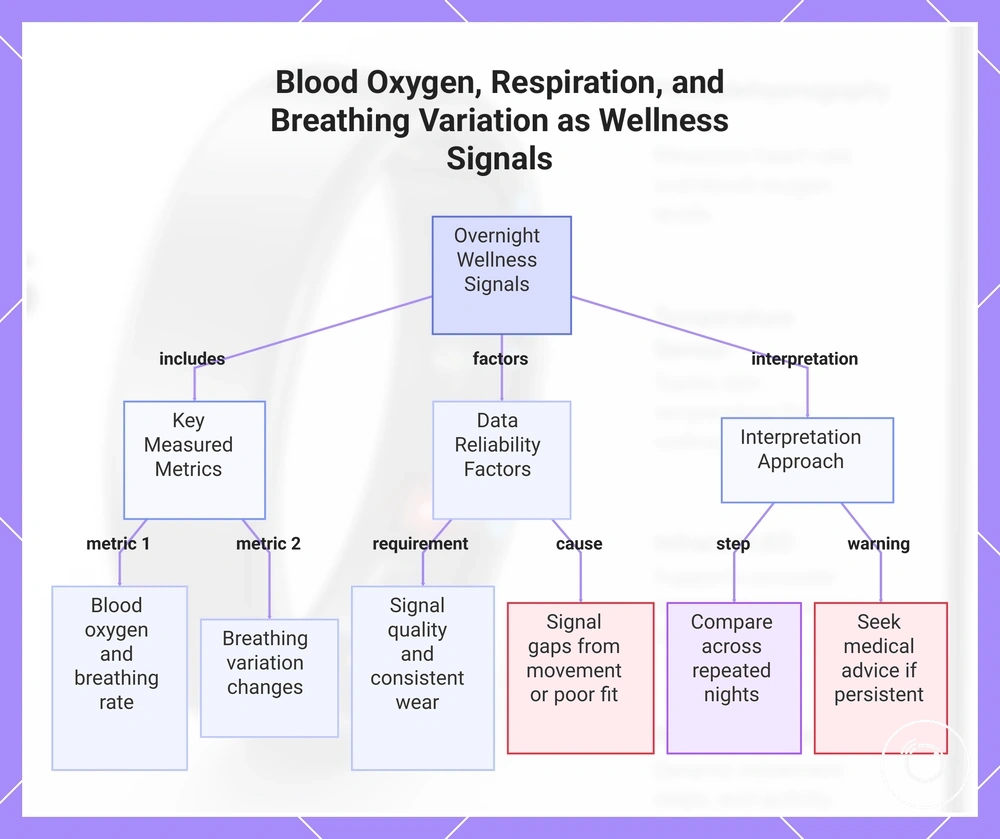
Blood oxygen, respiration, and overnight breathing variation are wellness signals that a smart ring estimates during sleep from optical and motion-related sensor data. Blood oxygen is commonly presented as a SpO2-style value, while respiration estimates breathing rate and breathing variation highlights changes in breathing regularity across the night. These overnight trends rely on signal quality, consistent nighttime wear, and supported device features, so they are most useful when interpreted across repeated sleep sessions rather than from a single reading.
Nighttime sampling allows a wearable ring to compare repeated measurements collected under similar sleeping conditions. Blood oxygen trends, respiration estimates, and breathing variation may provide additional wellness context when considered alongside heart rate, resting heart rate, and HRV, but signal gaps caused by movement, poor fit, or interrupted skin contact can reduce the completeness of overnight data. These measurements describe overnight patterns and should be interpreted as wellness indicators rather than universal or definitive assessments.
For example, repeated overnight reductions in blood oxygen or noticeable changes in respiration and breathing variation may justify closer personal observation when the same pattern appears across multiple nights. If concerning symptoms or repeated abnormal readings continue, appropriate medical advice should be sought because evaluating underlying health conditions is outside the scope of these wellness metrics.
This chart explains the key overnight wellness signals estimated by a smart ring, the conditions that affect data reliability, and the recommended steps for interpretation.
Sleep, recovery, and stress metrics from combined signals
Sleep, recovery, and stress metrics from combined signals are app-generated estimates that combine multiple sensor inputs rather than report the output of one sensor. A smart ring may combine movement, heart signals, breathing, temperature trend, and activity data to describe sleep timing, sleep stages, readiness, recovery, or stress. These combined metrics remain wellness interpretations shaped by the device model, personal baseline, and app weighting.
A sleep metric may combine movement, heart signal patterns, and breathing to estimate sleep timing and stage changes. Recovery and readiness commonly combine HRV, resting heart rate, temperature deviation, sleep inputs, and activity load against a personal baseline. A stress indicator may weight changes in HRV, temperature trend, breathing variation, and activity differently, so the resulting app score indicates a pattern within that system rather than a directly comparable value across brands.
Sleep, recovery, and stress metrics from combined signals organise raw inputs into broader interpretations. The table separates each combined metric from its main inputs and clarifies the interpretation limit of the resulting app score.
| Combined metric | Main inputs | What it may indicate | Interpretation limit |
|---|---|---|---|
| Sleep metric | Sleep timing, movement, heart signal, and breathing | Estimated sleep duration, continuity, and stage pattern | Stage estimates are app interpretations rather than direct observations of sleep state |
| Recovery and readiness | HRV, resting heart rate, temperature deviation, sleep inputs, and activity load | How current signals compare with the user’s established baseline | The score reflects model-specific weighting and does not establish fitness, illness, or preparedness |
| Stress score | HRV, temperature trend, breathing variation, heart signals, and activity context | A pattern that the app classifies as lower or higher physiological strain | The classification is conditional on baseline quality, available inputs, and the app’s scoring method |
Raw sensor signals and composite scores answer different questions: a raw signal records or estimates an input, while an app score combines selected inputs into a category, trend, or relative rating. Changes are therefore more useful when compared with the same user’s baseline and the same app over time, not treated as medically definitive or universally equivalent.
Readers comparing how these combined inputs contribute to nightly estimates can continue to fitness smart ring sleep tracking.
Sleep stages, sleep duration, and sleep consistency
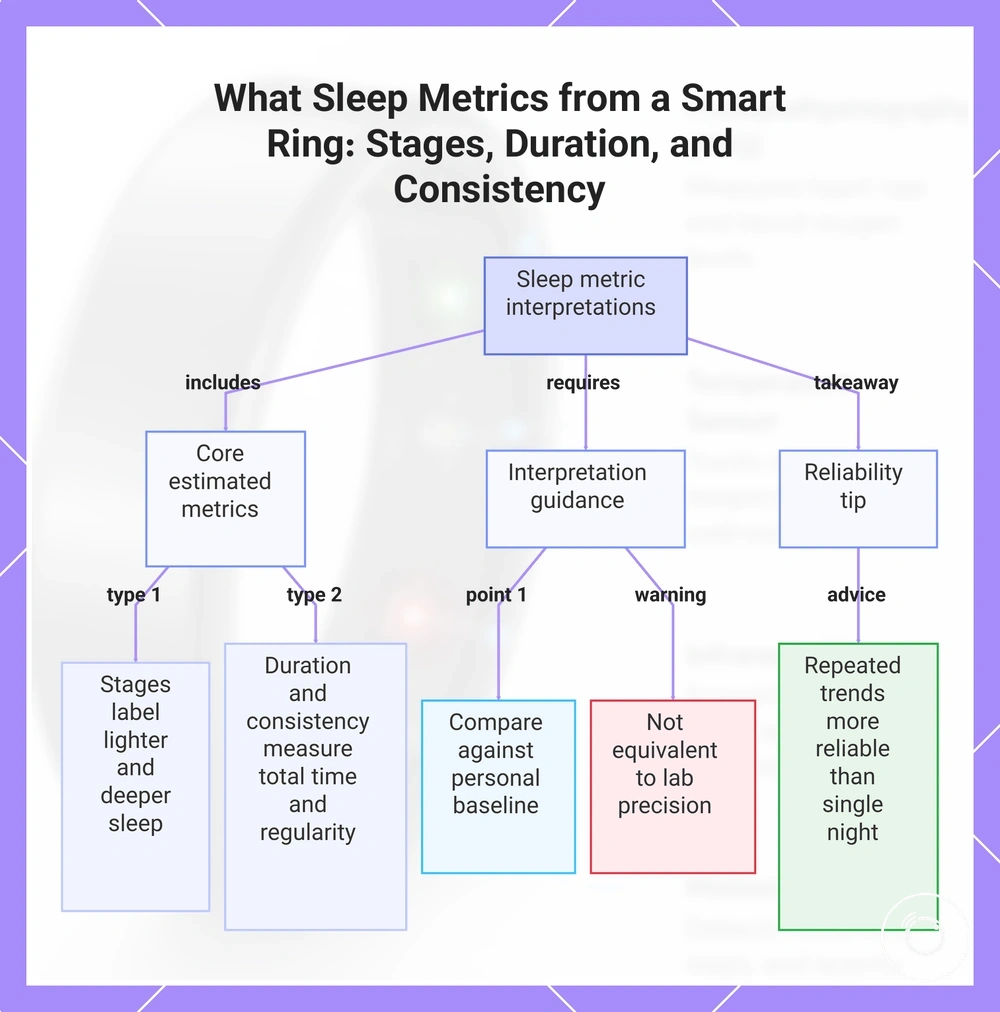
Sleep stages, sleep duration, and sleep consistency are sleep metric interpretations generated from overnight patterns rather than direct observations of sleep. A smart ring estimates stage labels, total sleep time, wake periods, and schedule consistency by combining movement, heart signals, breathing, and timing into an app score. These estimates are most useful when interpreted against a personal baseline and should not be treated as equivalent to laboratory precision.
Sleep stages label estimated periods such as lighter and deeper sleep, while sleep duration reflects the total time the app identifies as sleep and sleep consistency reflects how regularly sleep and wake times align across multiple nights. Recovery, readiness, HRV, temperature trend, and breathing provide supporting context for these overnight patterns without changing the meaning of the individual sleep labels. Together, these trends help explain how consistently sleep is recorded over time, while remaining qualified by model interpretation, signal quality, and app weighting.
For example, increased movement or repeated wake periods during the night can change stage estimates and reduce the consistency of overnight patterns even when total sleep duration appears similar. Comparing repeated trends instead of focusing on a single night's app score provides a more reliable local interpretation without supporting a medical conclusion.
This chart shows how a smart ring estimates sleep stages, duration, and consistency, and how these metrics should be interpreted against personal baseline and compared across nights for reliable insights.
Readiness, recovery, and stress indicators
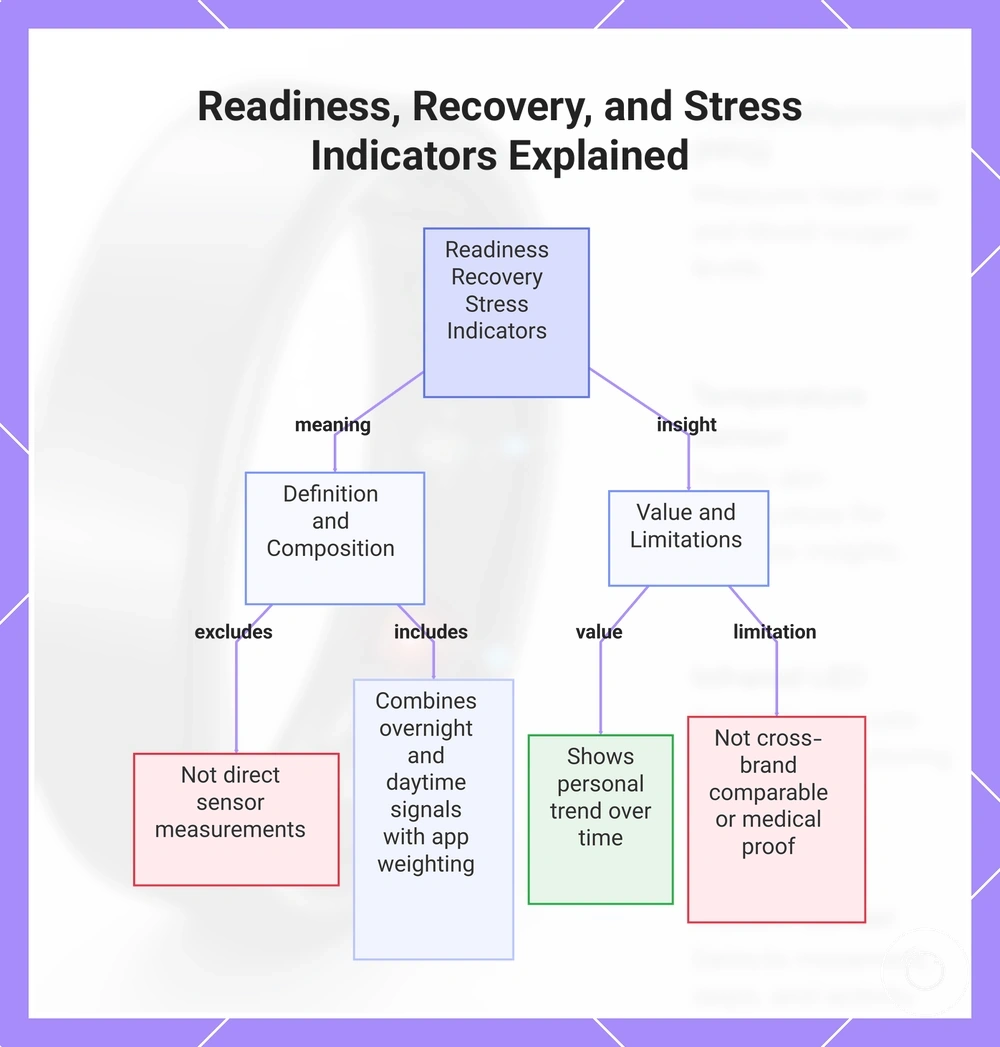
Readiness, recovery, and stress indicators are composite app outputs that combine multiple overnight and daytime signals rather than direct sensor measurements. A smart ring estimates each app score by weighting HRV, resting heart rate, sleep metric results, temperature trend, breathing, recent activity, and comparison with the user’s baseline. These scores reflect app-specific interpretation and are not directly equivalent across different brands.
Recovery and readiness app scores estimate how current measurements compare with a personal baseline, while a stress indicator reflects patterns that the app associates with increased physiological strain. App weighting can assign different importance to HRV, sleep quality, temperature trend, resting heart rate, and recent activity, so similar inputs can produce different outputs across platforms. Their clearest local value is showing personal change over time within the same app rather than supporting cross-brand comparison.
For example, poor sleep or an elevated temperature trend may contribute to a lower recovery-style app score when combined with changes in HRV or resting heart rate. That result signals a departure from the user’s baseline but does not prove the exact cause or support a medical conclusion.
This chart explains what composite app scores like readiness, recovery, and stress are, how they combine signals, and their practical value and limitations.
Activity and fitness metrics supported by ring sensors
Activity and fitness metrics supported by ring sensors are estimates generated from movement signals and the position of the ring on the finger. A smart ring combines movement signal data with heart-rate support to estimate steps, daily activity, and selected workout information rather than directly measuring every exercise. The reported activity metrics depend on model support and workout mode design, so the section focuses on realistic capabilities and boundaries.
Many wearable rings provide passive tracking for daily steps, movement trends, and background activity throughout the day. During active measurement, supported workout mode options may increase sensor sampling to provide heart-rate support and exercise summaries. Calories or energy estimates, when available, are calculated from movement, heart-rate context, and user profile information rather than measured directly. Workout classification therefore reflects the supported workout mode and available sensor inputs instead of identifying every exercise with complete certainty.
Activity and fitness metrics supported by ring sensors become easier to compare when each reported metric is linked to its primary sensor input and its practical limitation.
| Activity metric | Sensor input | Useful signal | Common limitation |
|---|---|---|---|
| Steps | Movement signal and hand motion | Daily activity estimate | Hand movements can influence step estimates. |
| Movement | Motion patterns | Passive tracking of daily activity trends | Does not classify every type of activity. |
| Calories or energy estimate | Movement, heart-rate support, and profile data | Relative energy estimate | Values remain model-specific estimates rather than exact measurements. |
| Workout mode | Movement signal and active measurement | Exercise summary and heart-rate context | Exercise classification is limited by supported workout modes. |
These activity metrics are most useful for monitoring personal trends with the same device instead of comparing results across different platforms. Criteria such as supported workout modes and sensor implementation determine what the ring can report; see fitness smart ring workout tracking for more detail. Ring-based exercise classification should not be treated as a complete sports tracker or a replacement for every smartwatch feature.
Steps, movement, and workout-related signals
Steps, movement, and workout-related signals are derived from finger-worn motion and heart data rather than direct observation of every activity. A smart ring combines a motion sensor, accelerometer, and heart-rate context to estimate steps, interpret a movement pattern, and generate an activity estimate during daily wear or supported workout modes. These signals remain influenced by hand movement, stationary exercise, and the workout mode available on the device.
Different signal types contribute to different activity estimates:
- Step pattern: The motion sensor and accelerometer detect repeated movement patterns associated with walking, but unrelated hand movement can produce false positive step estimates.
- Movement intensity: Movement patterns recorded during daily activity and sleep movement help distinguish inactivity, overnight patterns, and general activity levels rather than identifying specific exercise types.
- Workout-related signals: Elevated heart-rate context and movement patterns support an activity label during compatible workout modes, but stationary exercise or activities with limited finger motion reduce the detail available for exercise classification.
For example, a wearable ring may capture total daily movement more consistently than it identifies the exact exercise being performed. This helps explain why movement signals provide useful activity estimates while remaining qualified by hand movement, false positives, stationary exercise, and workout mode limitations.
Passive tracking compared with active workout measurement
Passive tracking compared with active workout measurement describes two different tracking behaviours that influence how a smart ring reports an activity metric. Passive tracking records background movement signals, steps, and daily trends automatically, while active measurement begins after a supported workout mode is started to collect additional heart-rate support and exercise context. This distinction affects what the app can infer because sampling behaviour and workout mode support differ between device models.
The comparison below highlights the practical differences between the two tracking behaviours:
- Passive tracking: Collects background signals automatically to estimate steps, movement trends, and daily activity without requiring the user to start a session.
- Active workout measurement: Starts after a workout mode is selected, allowing increased sampling frequency together with heart-rate support to generate activity labels and post-workout summaries when the device supports those features.
- Comparison: Passive tracking focuses on long-term daily trends, whereas active measurement provides additional exercise context that remains qualified by workout mode support, sampling behaviour, and device capabilities.
For example, sleep and resting metrics often remain more consistent because they rely on continuous background tracking, while workout summaries can differ according to sampling frequency, heart-rate support, and the selected workout mode. This comparison helps explain why exercise-related metrics often show more variation than passive daily tracking.
What smart ring health metrics can and cannot confirm
Smart ring health metrics are useful for identifying a wellness trend, but they are not automatic medical conclusions. A smart ring compares repeated measurements with your baseline to indicate meaningful patterns, while interpretation also depends on signal type, fit, wearing condition, context, and model variation. These metrics support wellness monitoring rather than clinical confirmation.
Changes observed over time are generally more informative than isolated readings because repeated patterns provide stronger context than a single measurement. Fit, consistent sensor contact, and wearing condition influence reading quality, while model variation affects how metrics are collected and interpreted. An unexpected result can indicate a change from your baseline, but it cannot confirm the reason for that change without clinical confirmation. If concerning symptoms accompany unusual readings, professional evaluation is appropriate.
What smart ring health metrics can and cannot confirm is easier to understand when each metric type is viewed within its interpretation boundary.
| Metric type | What it can suggest | What it cannot confirm | Safer interpretation |
|---|---|---|---|
| Heart-related metrics | Wellness trend or repeated pattern compared with your baseline | Clinical confirmation of a medical condition | Review long-term patterns and seek professional advice if symptoms are present. |
| Sleep metrics | Changes in sleep patterns over time | The underlying cause of disrupted sleep | Interpret trends across multiple nights rather than a single reading. |
| Activity metrics | General movement and daily activity patterns | Exact energy expenditure or a complete assessment of exercise | Compare results under similar wearing conditions and over time. |
Understanding these interpretation boundaries helps prevent overestimating individual readings while keeping smart ring metrics in the correct wellness context. For more detail about how fit, wearing condition, and model variation influence readings, see fitness smart ring accuracy.
Wellness trends versus medical measurements
Wellness trends and medical measurements describe different types of health information. Smart ring data is intended to identify a wellness trend by comparing repeated patterns with your baseline, while medical measurements require clinical confirmation before they support healthcare decisions. This distinction has a limitation because fit, wearing condition, sensor contact, and model variation influence reading quality.
Repeated patterns collected under similar wearing conditions provide more meaningful context than a single reading. A wellness trend can indicate that a value has changed from your baseline, but it cannot confirm the underlying reason or replace clinical confirmation when symptoms are present. Understanding this boundary helps interpret smart ring metrics as wellness information rather than medical measurements.
If persistent or worsening symptoms occur alongside unusual smart ring readings, professional medical evaluation provides the appropriate context for clinical confirmation, while the wearable ring remains useful for tracking wellness trends over time.
Model, fit, and wearing conditions that affect readings
Model differences, fit, and wearing conditions influence how consistently a smart ring records health data. Reliable readings depend on both the available hardware and the way the ring is worn, so a wellness trend is most meaningful when measurements are compared with your baseline under similar conditions. This limitation means readings should be interpreted alongside wear context rather than in isolation.
Use the following criteria when deciding whether a reading requires more cautious interpretation:
- Hardware: Model variation determines which sensors are available, while firmware and supported app settings influence how measurements are collected and presented.
- Fit and placement: A correctly sized ring with stable sensor contact on the intended finger is more likely to provide consistent reading quality than one that moves during wear.
- Wearing conditions: Skin contact, hand movement, and charging state can affect data continuity, making repeated patterns less suitable for comparison with your baseline when conditions change.
- Interpretation: Compare readings collected under similar wearing conditions before judging a wellness trend, and remember that clinical confirmation is still required when symptoms raise health concerns.
How smart ring apps turn metrics into daily trends
Smart ring apps turn sensor-derived metrics into daily, weekly, and longer-term trends by organising synced readings around a personal baseline. App tracking places each metric label on a dashboard, adds new values to the user’s history, and compares repeated measurements across time. These summaries support interpretation rather than providing a final judgment.
When readings sync from the smart ring, the app groups them by metric and time period before comparing them with earlier data. A stable history gives the baseline more context, while missing or inconsistent data limits the strength of a trend. Depending on app design and data quality, the dashboard may present an app score, notification, readiness-style summary, or coaching prompt to highlight a notable pattern.
How smart ring apps turn metrics into daily trends can be followed as a short sequence: raw readings sync into the history, metric labels organise the data, the dashboard compares the latest values with the baseline, and the app converts the result into a trend summary or prompt. The table shows how each part contributes to interpretation without implying universal coaching accuracy.
| Entity/part | Attribute/criterion | Value/condition | Effect or limitation |
|---|---|---|---|
| Raw readings | Sync and storage | Measurements are added to the app history when data transfer is complete | Creates the record used for later comparison; missing data reduces continuity |
| Dashboard | Metric organisation | Values are grouped by metric label and time period | Makes daily and weekly patterns easier to compare |
| Baseline | Trend comparison | Recent measurements are compared with the user’s established history | Highlights changes relative to the user’s usual pattern rather than an isolated reading |
| Notification or coaching prompt | Interpretive output | The app generates a prompt when its rules identify a notable change or pattern | Suggests cautious action or attention but remains dependent on app design and data quality |
Daily trends, notifications, and readiness-style scores are interpretation aids. They help organise patterns in the data, but their meaning should remain qualified by the baseline, available history, sync quality, and personal context.